Pipeline Render Block
The pipeline render block gives you a visual overview of your deal or ticket pipeline, showing each stage with its count and total value.
How It Appears
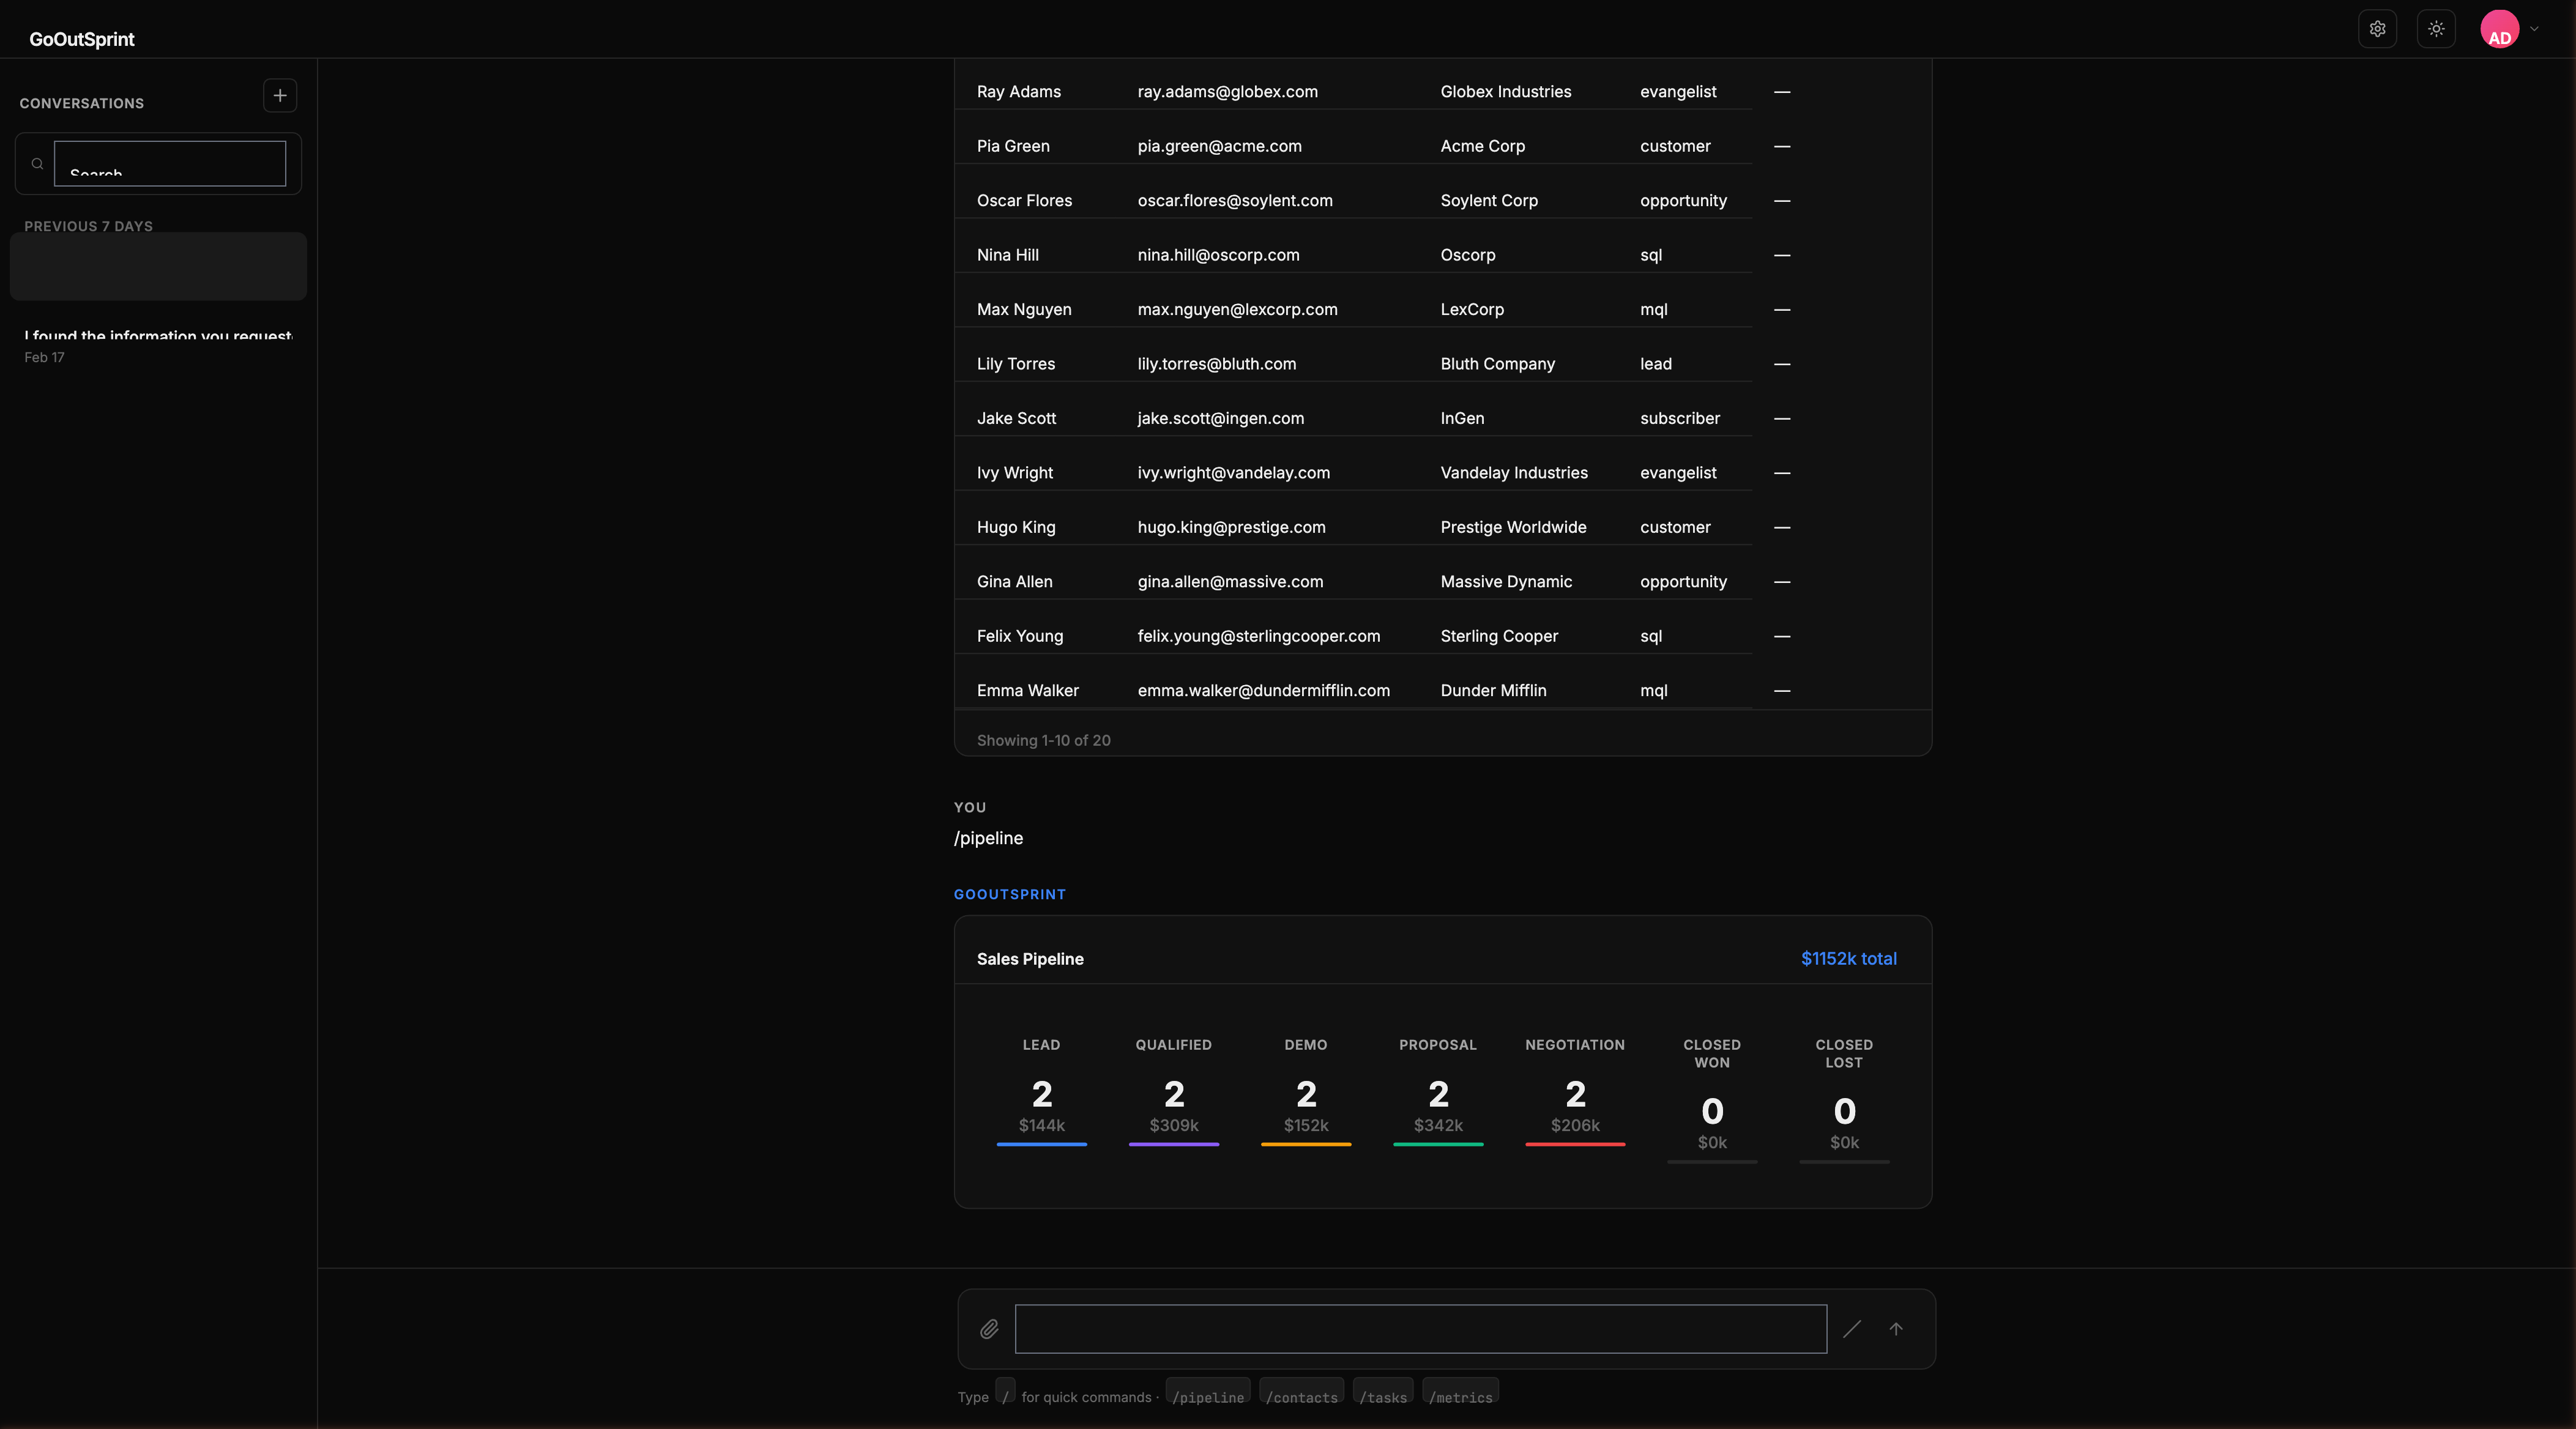
When you run /pipeline or ask "Show me the pipeline," Outsprint displays a horizontal stage visualization.
What You See
Each stage in the pipeline shows:
- Stage name as an overline label
- Deal count as a large metric number
- Total dollar value in secondary text
- Proportional bar showing the relative size of each stage
The pipeline header includes the total pipeline value as a badge.
Interacting with the Pipeline
Click any stage to drill down. This sends a message like "Show me all deals in Proposal Sent" to the chat, returning a table of deals in that stage.
Weighted Pipeline Value
The pipeline can display weighted values, calculated as each deal's amount multiplied by its probability percentage. This gives you a more realistic view of expected revenue.
Layout
- Desktop: Stages appear horizontally, left to right, matching the natural pipeline flow
- Mobile: Stages stack vertically as cards, each showing the stage name, count, and value
Pro Tip
You can view different pipelines by name. For example, /pipeline Enterprise Sales shows only that specific pipeline. Without a name, the default pipeline is shown.
What's Next
- Charts -- Visualize trends and metrics
- Kanban board -- Detailed drag-and-drop pipeline view
- Back to render blocks overview